The Guidelines deal with managing outdoor air quality over an area or region typically referred to as an 'air shed'.
An air shed is a volume of air, bounded by geographical and/or meteorological constraints, within which activities discharge contaminants. Air sheds can vary in size from relatively small areas within valleys, to urban-wide and even region-wide air sheds where the effects of urban air pollution (such as ozone) may extend over many kilometres. Within an air shed there may be areas where pollution levels are elevated because of a particular discharge or group of discharges, such as around one or two industries or around a busy, congested intersection. These may be referred to as 'bubble' areas or 'hotspots'.
Pollution levels within an air shed are influenced by complex interactions between the pollution sources, contaminants discharged into the air, meteorology, and topography. Information about all of these is required to understand the factors affecting pollution levels in an air shed, how they change over time and space, and the adverse effects they are having on people and the environment. Once this information is collected, effective strategies to improve or maintain air quality can be developed, discussed with communities and implemented.
Tools such as emissions inventories, air quality monitoring, atmospheric dispersion modelling, and predictions of trends in emissions and pollution levels should be used to obtain information for effective air quality management. While all these techniques are important, they are covered in other guidance documents, and will not be discussed in detail here. Instead this chapter focuses on how guideline values are used to understand the state of air quality, to determine particular air quality issues in a region, and to direct actions to manage it.
Developing and implementing an air quality management plan under the RMA or a reduction strategy generally occurs in five stages.
- Determine the state of the air and pressures on it and how these will change over time.
- Use monitoring data and national guideline values to establish regional criteria and reduction targets, where necessary.
- Devise management or reduction strategies and assess their costs and benefits.
- Refine strategies through community consultation and implement them.
- Evaluate the effectiveness of reduction strategies by assessing changes in the pressures on, and state of, the air environment and refine strategies if necessary.
The term 'reduction strategies' has been used broadly to include a range of options that can be implemented to manage air quality, including policies and rules in regional policy statements and plans, education programmes, national policies and regulations, and incentive schemes.
Guidance on using the guideline values in each of these stages is discussed in the following sections. The guidance builds on information in the 1994 Guidelines and takes into account the review of how the 1994 Guidelines have been applied. A summary of the guidance is contained in Appendix 2. Issues for Māori and use of guideline values in assessing individual discharges to air are also briefly discussed in sections 3.6 and 3.7 respectively.
Clearly, information about the air resource is important for effective air quality management. There is no point in developing measurable air quality guideline values or criteria if no sensible measurements and assessments are going to be made.
To determine the state of air quality and its effects on people's health, pollution levels must be monitored and compared with the guideline values, and, if necessary, detailed air shed modelling and health impact assessments should also be carried out. In this way it is possible to determine whether the air quality is good or bad, whether improvements are required, or whether it is already in a good state and should be maintained. It is also important to work out where the pollution is coming from - the pressures - and to use an emissions inventory to predict how these are changing over time.
Under section 35 of the RMA, councils are responsible for implementing air quality monitoring programmes. The extent of monitoring and the methods used will depend on the air quality issues facing each council. Many factors influence the monitoring needs of a region, such as resources and other environmental priorities. General guidance on establishing monitoring programmes is contained in the Good-practice Guide for Air Quality Monitoring and Data Management (Ministry for the Environment, 2000a).
The discussion below focuses on how to use the guideline values to make decisions about monitoring and to assess monitoring results.
In general, where contaminant levels exceed the guideline values, more detailed assessments of the health risks should be carried out and taken into account in planning activities.
3.2.1 Where do the guideline values apply?
The guideline values apply to outdoor air wherever a person might reasonably be expected to be exposed to the contaminant over the relevant averaging period.
Where the guideline value applies therefore depends on the specific contaminant, the relevant averaging period, and the spatial extent over which the guideline is likely to be breached. This is a precautionary approach, because if pollution levels at a peak site where someone may be affected are within the guideline value, then it is expected that pollution levels at other sites will also be within the guideline value.
For example, a contaminant with an annual average guideline value should be measured at a location where people are likely to spend a significant amount of time outdoors, such as a residential site. On the other hand, a one-hour average should be measured where a person may be exposed for around one hour. This includes peak sites such as traffic hotspots.
3.2.2 Amount and location of monitoring
Obviously it is impossible to monitor at every location where a person may be exposed to a particular contaminant. It is therefore necessary to select a number of representative sites, ranging from hot spots to background sites, to provide sufficient data with which to estimate the spatial and temporal variability in pollution levels and people's exposure. Where necessary, monitoring data can be supplemented with air shed modelling to create a map illustrating how exposures vary over time and weather conditions.
Urban areas in New Zealand differ widely in their geography, population, regulatory approaches and emissions characteristics. Consequently they have varying air quality issues, and a prescriptive national approach to monitoring is not appropriate. The following sections suggest the amount and type of monitoring for towns according to population in order to gauge compliance with the guideline values. Further guidance on selecting monitoring sites and monitoring methods for air-shed management can be found in Ministry for the Environment (2000a), and for industrial management in Compliance Monitoring and Emissions Testing of Discharges to Air (Ministry for the Environment, 1998a).
Areas with populations less than 25,000
In small urban areas (population less than 25,000) it may be impracticable to install permanent monitoring stations, mainly because of resource limitations. However, a short-term programme, possibly using screening monitoring methods, should be undertaken. If potentially elevated levels are found through the initial monitoring, more accurate monitoring methods can then be installed. Emission inventory data and a desktop evaluation of complaints, local meteorology and topography should be used to indicate where there are problem areas.
It is likely that the principal contaminant of concern for small urban centres will be PM10, or possibly PM2.5. The problem could be more wide ranging if there are significant industrial emissions (where a range of contaminants may be of concern), or there is a highway or roadway through a town or forestry/rural settlement (in which case roadside carbon monoxide and PM10 may be an issue). There are a number of small- to medium-sized towns in both the North and South Islands where PM10 concentrations could be high during the winter months, and it is important that these areas are properly assessed. Sulphur dioxide may also need to be monitored where there is significant coal burning.
It may be possible to make well-researched comparisons with other similar small urban areas that have been monitored, although this needs to be done carefully. Councils are encouraged to communicate and share information and possibly equipment; for example, through the EPI Programme and Air Quality Working Group. This will ensure efficient use of monitoring resources and avoid unnecessary duplication.
Areas with populations of 25,000-100,000
For large towns (population between 25,000 and 50,000) the minimum level of monitoring should include representative short-term surveys, certainly of PM10 or PM2.5 and carbon monoxide. Nitrogen dioxide should be measured where there is significant traffic congestion, and sulphur dioxide should be investigated in areas with significant coal or oil burning. If the results of the short-term programme show that ambient air concentrations breach - or are likely to breach - 66% of the guideline value, then at least one permanent monitoring site with the recommended measurement methods should be installed.
Areas with populations above 100,000
Monitoring in the main urban centres (including Auckland, Hamilton, Wellington, Christchurch and Dunedin) should involve extensive monitoring programmes using permanent and temporary sites, monitoring a range of contaminants. The monitoring data should be supported by regional air-shed modelling to develop a picture of the spatial and temporal variation in air pollution levels. Monitoring programmes in such areas have been developed by regional councils and are being evaluated through the Environmental Performance Indicators Programme.
Monitoring new contaminants
Councils and the Ministry, through its GEMS monitoring programme, will need to prioritise which of the new hazardous air contaminants to monitor and which methods to use. This can be done by considering the results of updated emission inventories including the new contaminants, and by checking existing monitoring data for contaminants that may be associated with the new contaminants. For example, high levels of PM10 from domestic fires may indicate high levels of benzo(a)pyrene.
Initial screening monitoring with simple methods such as passive samplers can be used to determine whether more accurate monitoring is required (see Table 2 below for recommended methods).
3.2.3 Recommended monitoring methods
Consistent monitoring methods should be used in New Zealand to ensure:
- good-quality data is collected
- data can be compared with both New Zealand and overseas data
- data can be used in epidemiological studies
- the effectiveness of different policy responses can be evaluated.
The recommended monitoring methods to determine compliance with the guideline values are listed in Table 2. Changes to 1994 monitoring methods are in given in bold. US EPA 'equivalent methods' are also recommended. These methods are derived from the review of potential methods in Air Quality Technical Reports 12 and 13 (Denison et al, 2000; Chiodo and Rolfe, 2000).
Table 2: Recommended monitoring methods
| Contaminant | Revised or new method |
|---|---|
|
Carbon monoxide |
AS3580.7.1 - 1992 |
|
Particles (PM10)* |
US 40 CFR Part 50, Appendix J |
|
Particles (PM2.5)* |
US 40 CFR Part 50, Appendix L |
|
Nitrogen dioxide |
AS3580.5.1 - 1993 |
|
Sulphur dioxide |
AS3580.4.1 - 1990 |
|
Ozone |
AS3580.6.1 - 1990 |
|
Hydrogen sulphide |
AS3580.4.1 - 1990, coupled with a hydrogen sulphide to sulphur dioxide converter |
|
Lead content of PM10 |
US 40 CFR Part 50, Appendix J US 40 CFR Part 50, Appendix G |
|
Benzene and 1,3-butadiene |
US EPA method TO-1 |
|
Formaldehyde and acetaldehyde |
US EPA method TO-11A |
|
Benzo(a)pyrene |
US EPA method TO-13A |
|
Mercury, chromium, arsenic as particulates |
PM10 sampling in accordance with 40 CFR Part 50, Appendix J, followed by analysis using atomic absorption spectroscopy or an equivalent method. For Mercury - Method IO-5 (Sampling and Analysis for Vapour and Particle Phase Mercury in Ambient Air Utilising Cold Vapour Atomic Fluoresce Spectrometry). |
* Where a tapered elemental oscillating microbalance (TEOM®) is used to monitor PM10 and PM2.5, another recommended monitoring method should be co-located at the site for at least one year to calculate an appropriate adjustment factor.
Screening methods (such as passive sampling) can be used where a detailed programme is not warranted, or as an adjunct to a comprehensive programme to assess spatial variability. However, it is inappropriate to use screening methods to determine whether an air shed complies with the guideline values.
Approving alternative and new monitoring methods
There may be methods that do not have US EPA equivalency but collect sufficiently accurate results that can be compared with guideline values. The person or organisation intending to use or develop a method can apply to the Ministry to seek its consideration for inclusion in Table 2.
Once an application is received, the Ministry will convene an expert working group to consider the method and any studies of its accuracy. The expert working group will recommend whether to add the method to the list in Table 2 and the list will be re-issued via the Ministry's web pages.
3.2.4 Comparing monitoring data to guideline values
Many factors affect pollution levels measured at a particular site, including:
- proximity and type of emissions sources
- background or natural concentrations
- monitoring method used
- meteorology
- quality assurance checks
- atmospheric reactions
- topography.
Careful analysis of how these factors interact and influence pollution levels is required to understand and interpret the data collected at a site.
The first stage is usually to determine whether the contaminant concentrations recorded comply with the guideline values. This usually focuses on the magnitude and frequency of peak monitoring results. As part of the quality assurance process, the reasons for the peak values must be investigated. Some peaks may not be valid results (for example, due to equipment failure), or they may be valid but occur because of unusual events (for example, Guy Fawke's night or a diesel generator parked nearby).
It is difficult to develop a general national approach that takes into account different guideline averaging times, site characteristics and monitoring result variability. However, where there is insufficient information about the reasons for peak results, the Ministry has recommended a set of percentiles that can be used for analysing the data.
For 24-hour guideline values where daily data are collected, the Ministry recommends using the annual 99.5 percentile to judge compliance with the guideline value. This allows for two 24-hour averages collected over a year to be excluded from determining whether pollution levels at the site meet the guideline value. For 1-hour and 8-hour averages, the annual 99.9 percentile can be used. Percentile limits can only be applied when there are a large amount of data, and are therefore more appropriate where substantial continuous monitoring of short-term concentrations (hourly or less) has been carried out.
If, on the other hand, there is sufficient information to say that the peak values occur relatively frequently (on the basis of several years of data) and that they are not anomalous or invalid, it would be appropriate to use them to judge compliance.
Probably the most common ambient-monitoring method used in New Zealand at permanent monitoring sites is 24-hour measurement of PM10 by manual gravimetric methods on a 1-day-in-6 cycle. With this method there is insufficient data collected over a year to apply a sensible annual percentile limit, so the peak results should be used. The peaks should also be used for longer-term measurements, such as 7-day measurements, monthly means and annual averages.
3.2.5 Emission inventories
Emission inventories are an integral part of air quality management. They are used to understand the 'pressures' on air quality in an air shed - contributions from different emissions sources, and how emissions may change over time and space. They are also important in determining potential background or natural sources of pollution, especially for contaminants such as PM10, whose background concentrations from natural sources may be significant. Most regional councils have prepared and used inventories in their regional planning, although the inventories vary in detail and complexity.
Emissions inventory data enables strategies to be tailored to address emission sources in order of their contribution to the pollution problem. In this way, the major sources can be targeted and the biggest improvements achieved. Inventory models can also be used to assess and compare the effectiveness of potential reduction measures.
Although emissions from a particular source are often proportional to its contribution to ambient air concentrations, this cannot automatically be assumed and should be carefully analysed. Other factors affecting pollution levels monitored at a site, such as meteorology and time of day of the emission, need to be carefully examined and, where appropriate, air shed modelling should be used to estimate the relationship between emissions and concentrations.
Guidance on preparing and interpreting inventories is available from the Sustainable Management Fund web site (Wilton, 2001) and will not be provided here. Suffice to say an inventory is crucial for effective air quality management.
Once there is sufficient information about the level of air pollution, the factors affecting it and the pollution sources, it is then possible to develop regional criteria, set emission reduction targets and devise emission reduction strategies.
Through regional plan development under the RMA some clear steps for developing regional criteria and reduction targets have evolved. The guidance below summarises this experience, and aims to improve national consistency while enabling sufficient flexibility for councils to address regional circumstances and community aspirations. The approach described is therefore not intended to be unduly prescriptive.
3.3.1 Regional air quality criteria
The national guideline values can be used to set quantifiable region-specific criteria (a concentration-based goal for air quality) based on local monitoring results and community consultation.
The main goal for sustainable air quality is to maintain air quality where it is good and to improve air quality where it has been degraded and is affecting people's health. When it comes to guideline values, this means that where pollution levels breach a guideline value, emissions into the air shed should be reduced so that breaches do not occur; where possible, further improvements should also be made (particularly for those contaminants with no threshold level for adverse effects). It also means that where air quality does not breach the guideline values but looks like it might worsen over time (based on emissions inventory predictions), action should be taken to prevent it from breaching the guideline value. This is particularly important because measures required to reduce emissions may take some time to be implemented and become effective.
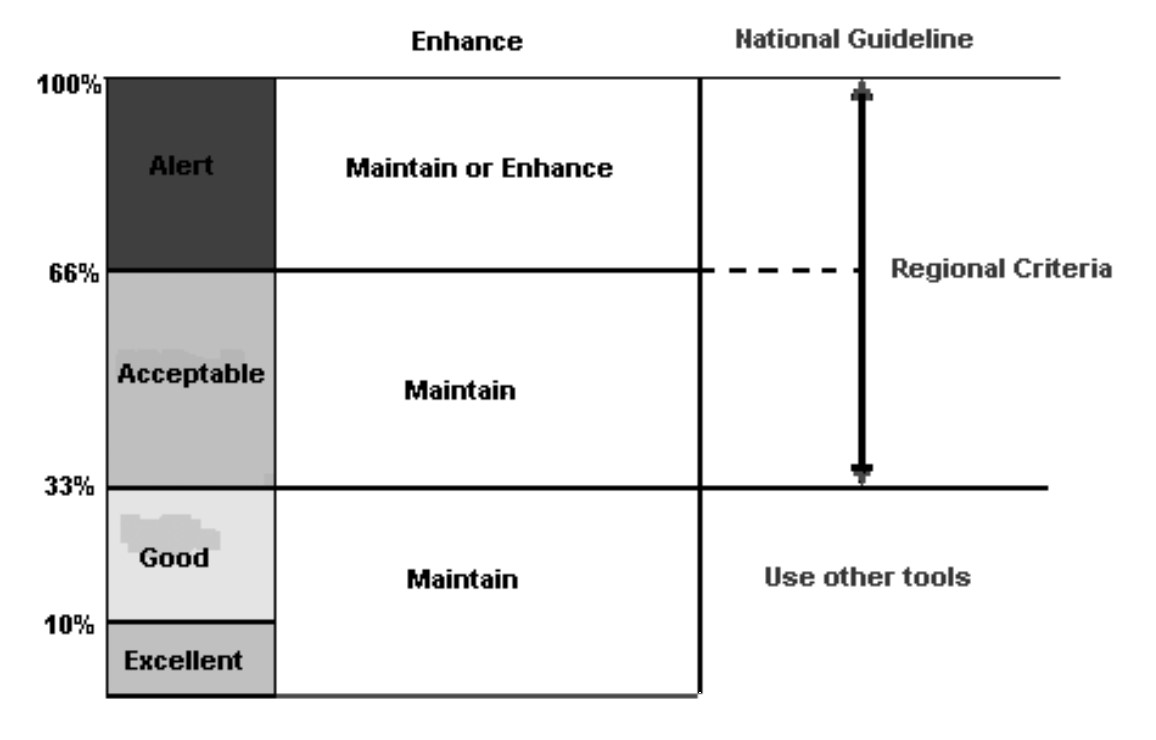
A framework for directing this process and establishing regional criteria using air quality 'categories' has been developed through the Environmental Performance Indicators (EPI) Programme. Table 3 lists five air quality categories. While these values are somewhat arbitrary, they have been widely used in planning processes since their introduction in 1997.
Table 3 shows that pollution levels recorded above 66% of any national guideline value fall within the 'alert' category, as defined by the EPI Programme. This warning level indicates that the guideline value could be exceeded if upward trends are not curbed. In a sense, this provides a definition of degraded air because it implies that 66% of the guideline is the threshold above which it is necessary to consider taking action to maintain or reduce emissions into the air shed. In this situation it may be necessary to develop policies aimed at curbing a potential upward trend, or at enhancing air quality - depending on the circumstances, local community aspirations and the costs and benefits of the actions required.
Table 3: EPI programme air quality categories
| Category | Measured value | Comment |
|---|---|---|
|
Action |
Exceeds the guideline value |
Exceedances of the guideline are a cause for concern and warrant action, particularly if they occur on a regular basis. |
|
Alert |
Between 66% and 100% of the guideline value |
This is a warning level, which can lead to exceedances if trends are not curbed. |
|
Acceptable |
Between 33% and 66% of the guideline value |
This is a broad category, where maximum values might be of concern in some sensitive locations, but are generally at a level that does not warrant urgent action. |
|
Good |
Between 10% and 33% of the guideline value |
Peak measurements in this range are unlikely to affect air quality. |
|
Excellent* |
Less than 10% of the guideline value |
Of little concern: if maximum values are less than a 10th of the guideline, average values are likely to be much less. |
* The 'excellent' category should not be applied to PM10 because the level of detection of most monitoring methods is not accurate enough.
Regional criteria should be based on monitoring data indicating current air quality and community aspirations for the level of air quality desired in an area or region. They can have a spatial extent, such as a particular city area, receiving environment or monitoring site type. Regional criteria should not be less stringent than national guideline values.
In general, the top of the acceptable category range is appropriate to maintain and protect air quality in most areas of New Zealand where, although there is limited information, the air quality is generally clean and there are no specific issues. Typically, this would apply to rural areas or small- to medium-sized urban areas without too many problems.
Figure 1 illustrates the range of potential values considered appropriate for region-specific criteria.
Figure 1: Potential range of values for regional criteria based on the EPI categories

Areas that are pristine or of special sensitivity should fall within the 'good' or 'excellent' categories listed in Table 3. However, it is not usually practicable to use the lower values to manage emissions in these areas. Any measure of performance against numerical guideline values relies on traditional ambient air monitoring techniques, and these are often unable to provide a sensitive enough measure when the air is very clean. In any case, most authorities would not monitor areas where air quality is this good because they tend to be remote pristine areas.
For those areas considered pristine or of special significance, one or more of the following management tools should be considered:
- criteria based on visibility degradation (Ministry for the Environment, 2001b)
- specific ecosystem criteria based on critical levels, or a biological monitoring criterion (see Chapter 4)
- broad site limitations for certain activities in sensitive areas (guidance on these will be available in the guide to assessing discharges to air).
3.3.2 Emission reduction targets
Once information is available about the state of air quality and the pressures on it, and regional criteria have been determined, it is then possible to quantify the emission reductions required from different sources to achieve the criteria or guideline value. Reduction targets are the percentage amount by which emissions into the air shed should be reduced from each source. For example, a 50% reduction in PM10 emissions from domestic fires is required to ensure that the PM10 guideline value of 50 µg/m3 (24 hours average) is not exceeded. The reduction target can be used to evaluate the effectiveness of different options for reducing emissions.
Reduction targets are usually based on peak monitoring results, emission inventory information, the guideline value (or regional criteria), any air-shed modelling, and investigations determining the relationship between emissions and concentrations measured at a monitoring site. The following need to be taken into account:
- whether monitoring data from the site are representative of pollution levels in the air shed, including peak values
- the accuracy of monitoring results
- any health effects assessments highlighting particular areas or contaminants of concern
- atmospheric dispersion modelling that explains the relationship between emissions and ambient concentrations
- community aspirations for emissions reductions
- the emission sources requiring greatest control, estimated through an emissions inventory and, where necessary, atmospheric dispersion modelling.
To determine reduction targets, councils should also consider the following:
- Do the peak values represent relatively frequent pollution events that are likely to cause health effects?
- Were there any unusual circumstances when the peak values were monitored (for example, bonfire night, diesel generator parked nearby)?
- Have the peak values occurred relatively frequently over the past few years?
- How accurate is the monitoring method?
If the peak values represent relatively frequent pollution levels and are not anomalous, then it is appropriate to base the reduction target on the peak results (possibly averaged over a number of years). If there is reason to believe that the peak results are not representative of typical peak pollution levels, then the monitoring results should be considered carefully. If one or more peak results are determined to be anomalous or do not occur on a regular basis, they should not be used to calculate the reduction target. If it is not possible to confirm whether the peak results are anomalous or otherwise, the 99.5 percentile should be used for 24-hour averages and the 99.9 percentile for 1-hour and 8-hour averages.
As a policy decision, councils can opt for a staged approach whereby the strategy or plan aims to reduce emissions based on one breach by a certain date, followed by an increase in measures to ensure there are no breaches of the guideline value by a subsequent date. Alternatively, councils can commit to reviewing the plan by a specific date and to changing the measures according to new monitoring data and analysis.
Reduction strategies include a range of options that can be implemented to manage air quality, including regional air quality plans, education strategies, national regulations and incentive schemes. A discussion on each of these is beyond the scope of this document, but it is important to note that any strategy and individual measures within a strategy should aim to achieve the reduction targets by a certain date (target date). Their development must include community consultation and an analysis of the costs and benefits of the chosen measures.
In summary, strategies for improving air quality should include sound policies based on the following information:
- a permanent ambient air monitoring programme, representative of the areas in question
- emission inventory studies to identify key sources and how they change over space and time - both short term and long term
- analysis and projection of trends in emissions, influencing factors and air pollution levels
- where possible, atmospheric dispersion modelling studies and exposure assessments to determine the spatial extent and frequency of areas where pollution levels exceed the guideline value, and their impacts
- analysis of the options for improving air quality and their cost effectiveness
- community views on the desirable level of air quality and options required to improve it
- analysis of potential other causes, such as one-off events (for example, volcanoes) and large-scale weather/climate influences (for example, El Nino).
Human health surveys, exposure assessments, risk assessments or biological monitoring studies may also be appropriate in some circumstances to determine the actual health effects of pollution and to refine reduction strategies. Such studies must be based on rigorous research techniques.
3.4.1 Assessing costs and benefits
Section 32 of the RMA requires any persons responsible for achieving its purpose to consider the costs and benefits of any objective, policy or rule, and to consider potential alternatives that could be pursued. Other matters that should be considered by councils include indirect effects that occur as a consequence of implementing the measure.
More detailed guidance on how to undertaken a full section 32 analysis is contained within the What Are the Options? A guide to using Section 32 of the Resource Management Act (MfE, 2000d).
The guideline values in this report do not negate the need for councils to undertake full cost-benefit assessments in accordance with section 32 when developing regional plans.
National policies and regulations must also be accompanied by a full regulatory impact assessment that includes consideration of costs and benefits of implementing policies or particular regulations.
3.4.2 Community consultation
Consultation with the community is also an integral part of regional air quality management and plan development under the RMA, and for national policy development.
Councils and central government agencies should ensure that the community is kept informed about air quality (especially where it does not meet the guideline values), the main pollution sources, and their potential effects on people's health and well-being. Adequate information is particularly important when discussing the potential cost of improvement options and when asking the community to make decisions on the actions required to improve air quality.
Methods for presenting air quality monitoring information are being developed by councils, the media and the Ministry. The Good-practice Guide to Air Quality Monitoring and Data Management (Ministry for the Environment, 2000a) the Ministry's The Air We Breathe web pages, regional state of the environment reports and the EPI Programme all have useful examples and guidance on how to present and interpret monitoring data, and how to communicate monitoring results to the general public.
Once reduction strategies and actions are implemented, their effectiveness needs to be assessed over time by ongoing air quality monitoring and analysis of the pressures.
Assumptions used to predict the effectiveness of different measures should be checked. For example, if an emission inventory model was used to predict the reductions associated with a particular policy, the assumptions used in the model should be periodically checked and re-evaluated.
Likewise, air quality monitoring can be used to check predicted improvements in air quality, taking into account the influence on meteorology. Given the factors affecting air quality it may take a number of years before a clear trend can be determined.
If evaluation shows that the predictions were inaccurate and the rate of anticipated improvements is not being achieved, plans and policies should be reviewed and revised. The same applies if improvements are faster than anticipated and particular rules or policies are perhaps not needed as urgently.
Traditionally Māori have had a close relationship with the environment, of which air quality is an important part. Iwi and mana whenua have traditionally exercised their roles as kaitiakitanga, and this role differs in each area.
The way in which Ngai Tahu may choose to exercise their role of kaitiaki in Christchurch might be different from the way it is done in Kawerau by Tuwharetoa-ki-Kawerau. And clearly, for urban Māori this could again be markedly different from the practise of Māori living in rural areas.
The practice of kaitiakitanga will be largely influenced by the nature of the influence in their geographical area. Iwi and mana whenua may seek to employ a vast range of differing tools both traditional and modern in order to meet these responsibilities.
In developing guidelines the Ministry has aimed to provide flexibility so that local regional approaches can be tailored to local circumstances. The recommended approach of applying guidelines and developing management options at a regional level under the RMA will enable Māori to be better placed to establish regional measures that are consistent with the tikanga, history and present expectations of that region.
For this to work effectively, there needs to be a good relationship between local iwi and regional councils. The Ministry has produced guidance on how to build relationships with local iwi: Talking Constructively: A practical guide for building agreements between iwi, hapu and whanau and local authorities, and Iwi and Local Government Interaction under the Resource Management Act 1991: Examples of good practice. Both of these are available from the Ministry's publications department.
As was stated in the 1994 Guidelines, the ambient guideline values are not designed to be used to assess the environmental and health impacts of individual discharges to air as required by the RMA, or a regional or district plan. Individual discharges include point, area or line sources from activities such as industries, roads and sewage-treatment plants.
We recognise, however, that in the absence of alternative guidance the guideline values will be used in such assessments and have, at times, been applied inappropriately. National advice on how they should and should not be applied to individual discharges is therefore needed to improve the quality and consistency of assessments.
The Ministry suggested several options for national guidance on assessing individual discharges in the discussion document (Ministry for the Environment, 2000c). A number of submissions requested more detailed investigation into the options and suggested a separate guidance document to cover issues such as: national assessment criteria (modelling design concentrations), effective consent conditions, tailoring assessments to the scale and significance of the discharge, notification procedures and mitigation options.
A draft of the new assessment guide will be available for comment by the end of 2002. It will be consistent with the Guide to Atmospheric Dispersion Modelling due to be released for comment in mid-2002.
However, it is useful to briefly look at how the ambient guideline values should not be used to assess individual discharges, and to highlight key issues that must be taken into account in assessing the environmental impacts of individual discharges through the resource consent and plan processes.
In general, guideline values:
- should not usually be used as limits to pollute up to by one industry
- should not be applied without taking into account the sensitivity of the receiving environment
- should not be applied without considering background concentrations and potential cumulative effects
- should only be used as part of a full assessment of environmental effects as required under the RMA.
Other factors that should be considered include:
- the best practicable option for reducing emissions
- the accuracy of atmospheric dispersion modelling results
- community views
- the need for a full health risk assessment
- any other RMA or regional plan requirements.
In many cases other criteria such as shorter-term 'modelling design concentrations' developed specifically for the hot spot or bubble area, or the type of individual discharge, may be more suitable. In addition, ambient guideline values, such as PM10, may not be suitable for assessing certain discharges, such as nuisance dust from dust generating activities. Guidance on assessing and managing dusty activities is contained in the Good-practice Guide for Assessing and Managing the Environmental Effects of Dust Emissions (Ministry for the Environment, 2001a).
See more on...
3 - Applying the Guideline values to Air Shed Management
May 2002
© Ministry for the Environment